Stretch run of the #moznewslab has me stretching my sense of what is possible ... in a good way
Published 2011-07-25
A “six degrees of separation” database, nwsmkr will combine a journalist’s curated notes with public contributions & social APIs to visualize connections and distinctions between public figures, providing a new storytelling method for news organizations.
What's a 35-year-old man to do over the weekend when his wife is out of town? What else -- Pretend he knows how to develop a news application that will benefit journalists and news consumers.
No, seriously, that's what I did.
I managed to narrow the scope of my Mozilla-Knight Journalism Learning Lab idea for a "DRY" Approach to News down to nwsmkr, which I envision as a “six degrees of separation” database that combines a journalist’s curated notes with public contributions, and social APIs to visualize connections and distinctions between public figures.
All in all, I feel I made some solid progress since Friday:
- I nailed down a one-sentence pitch
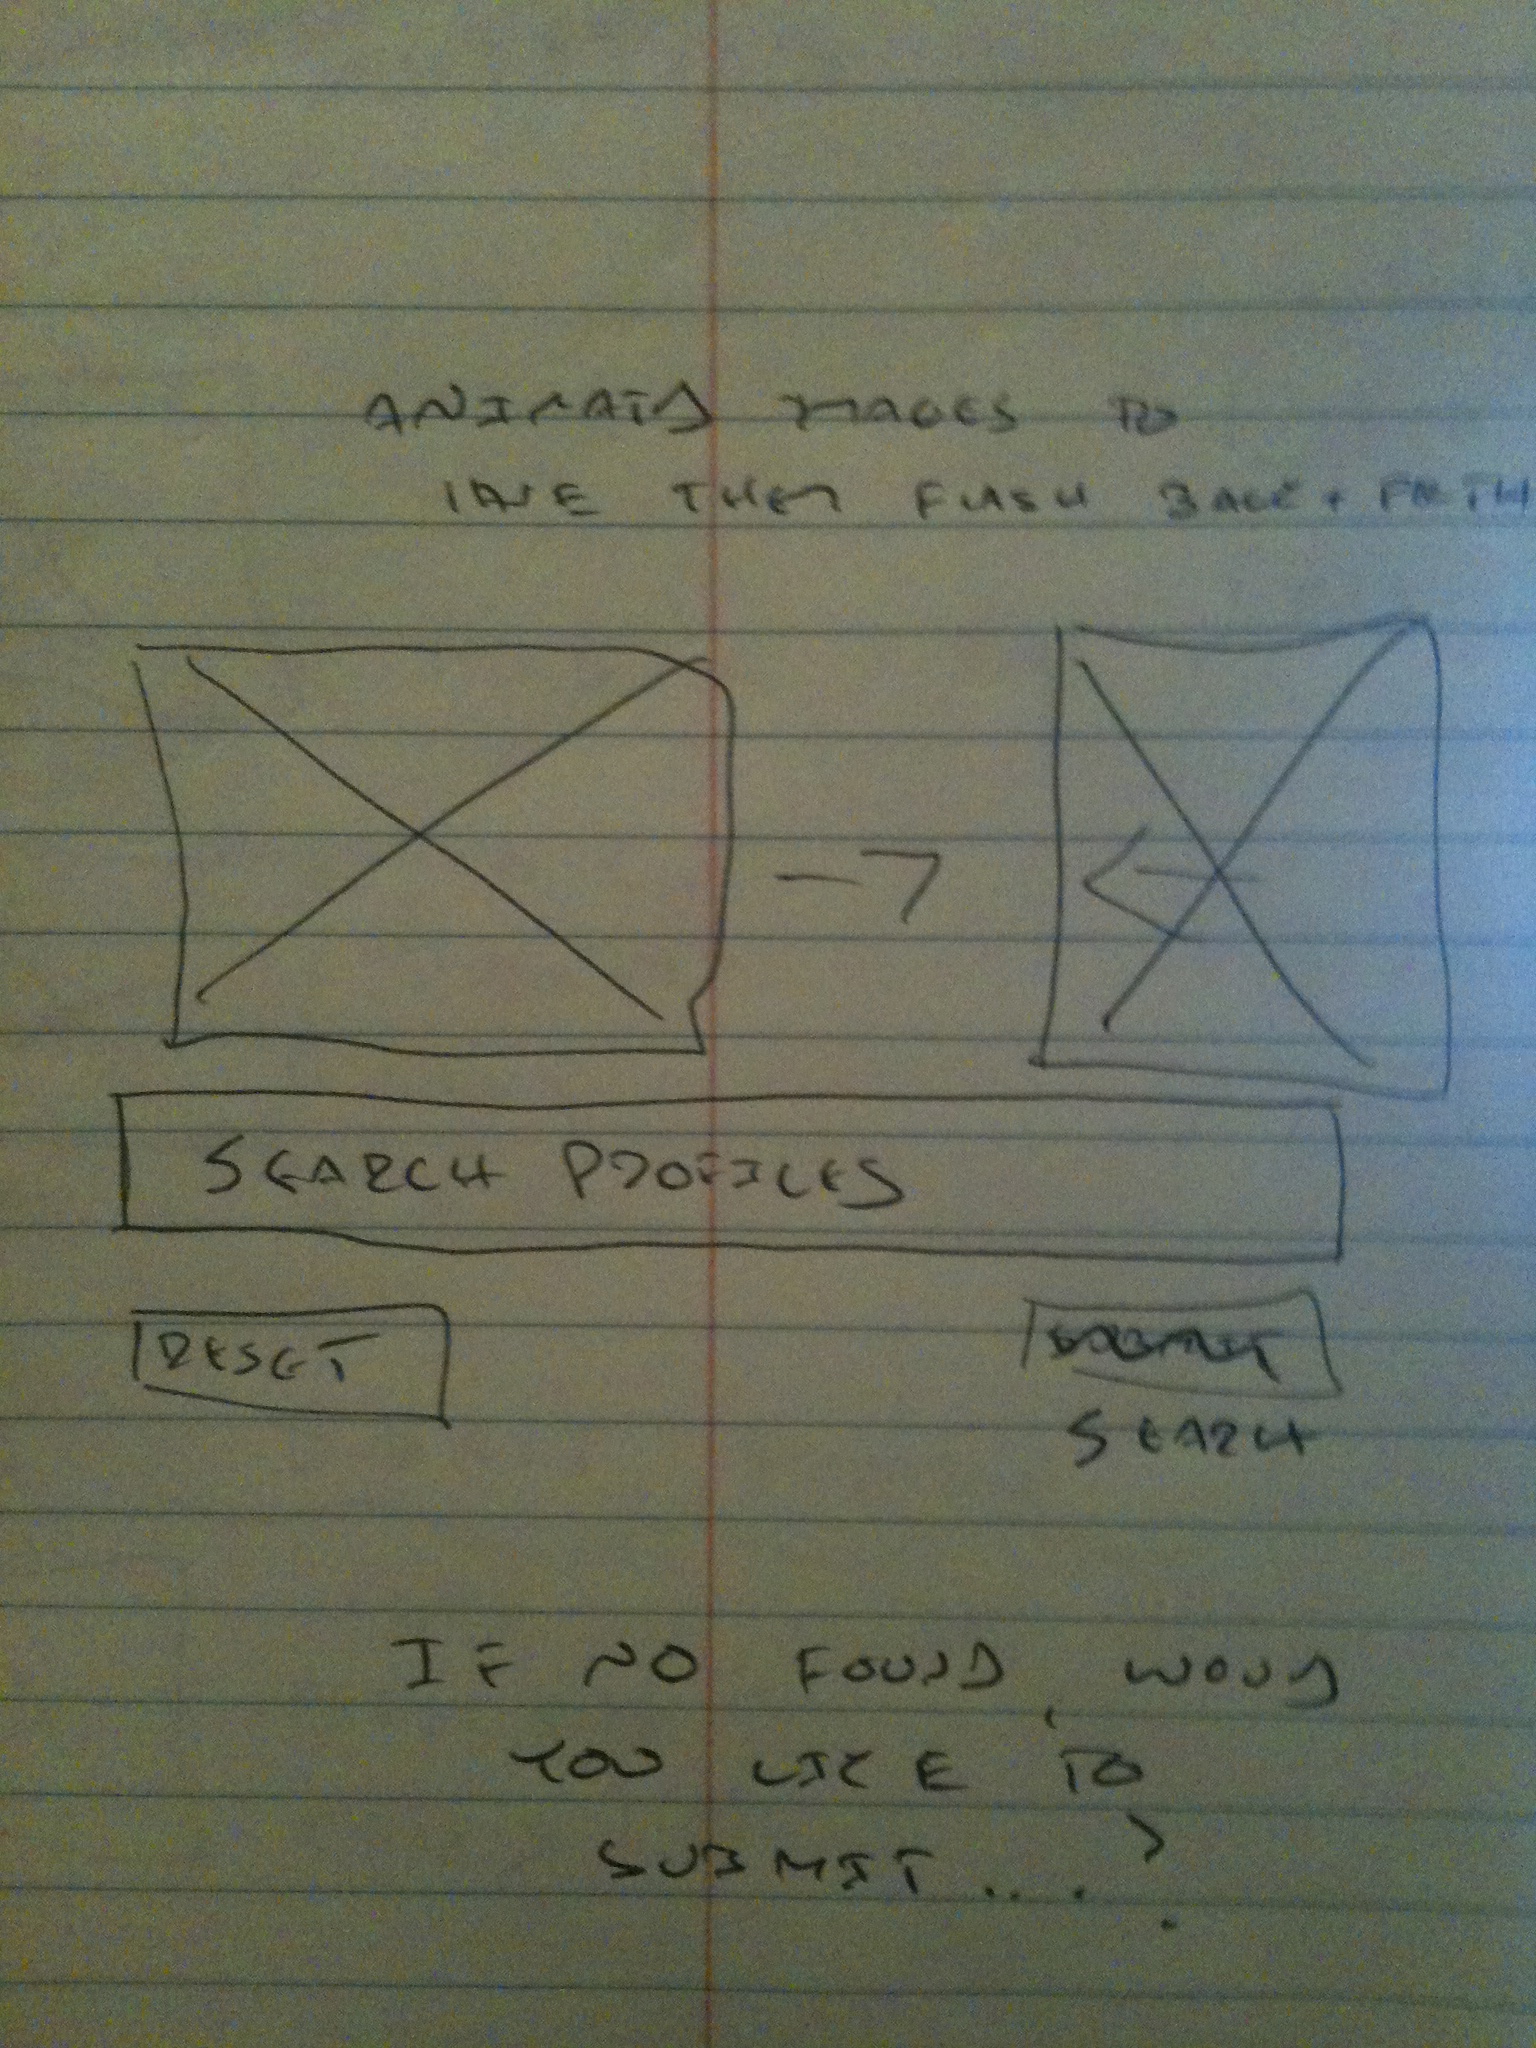
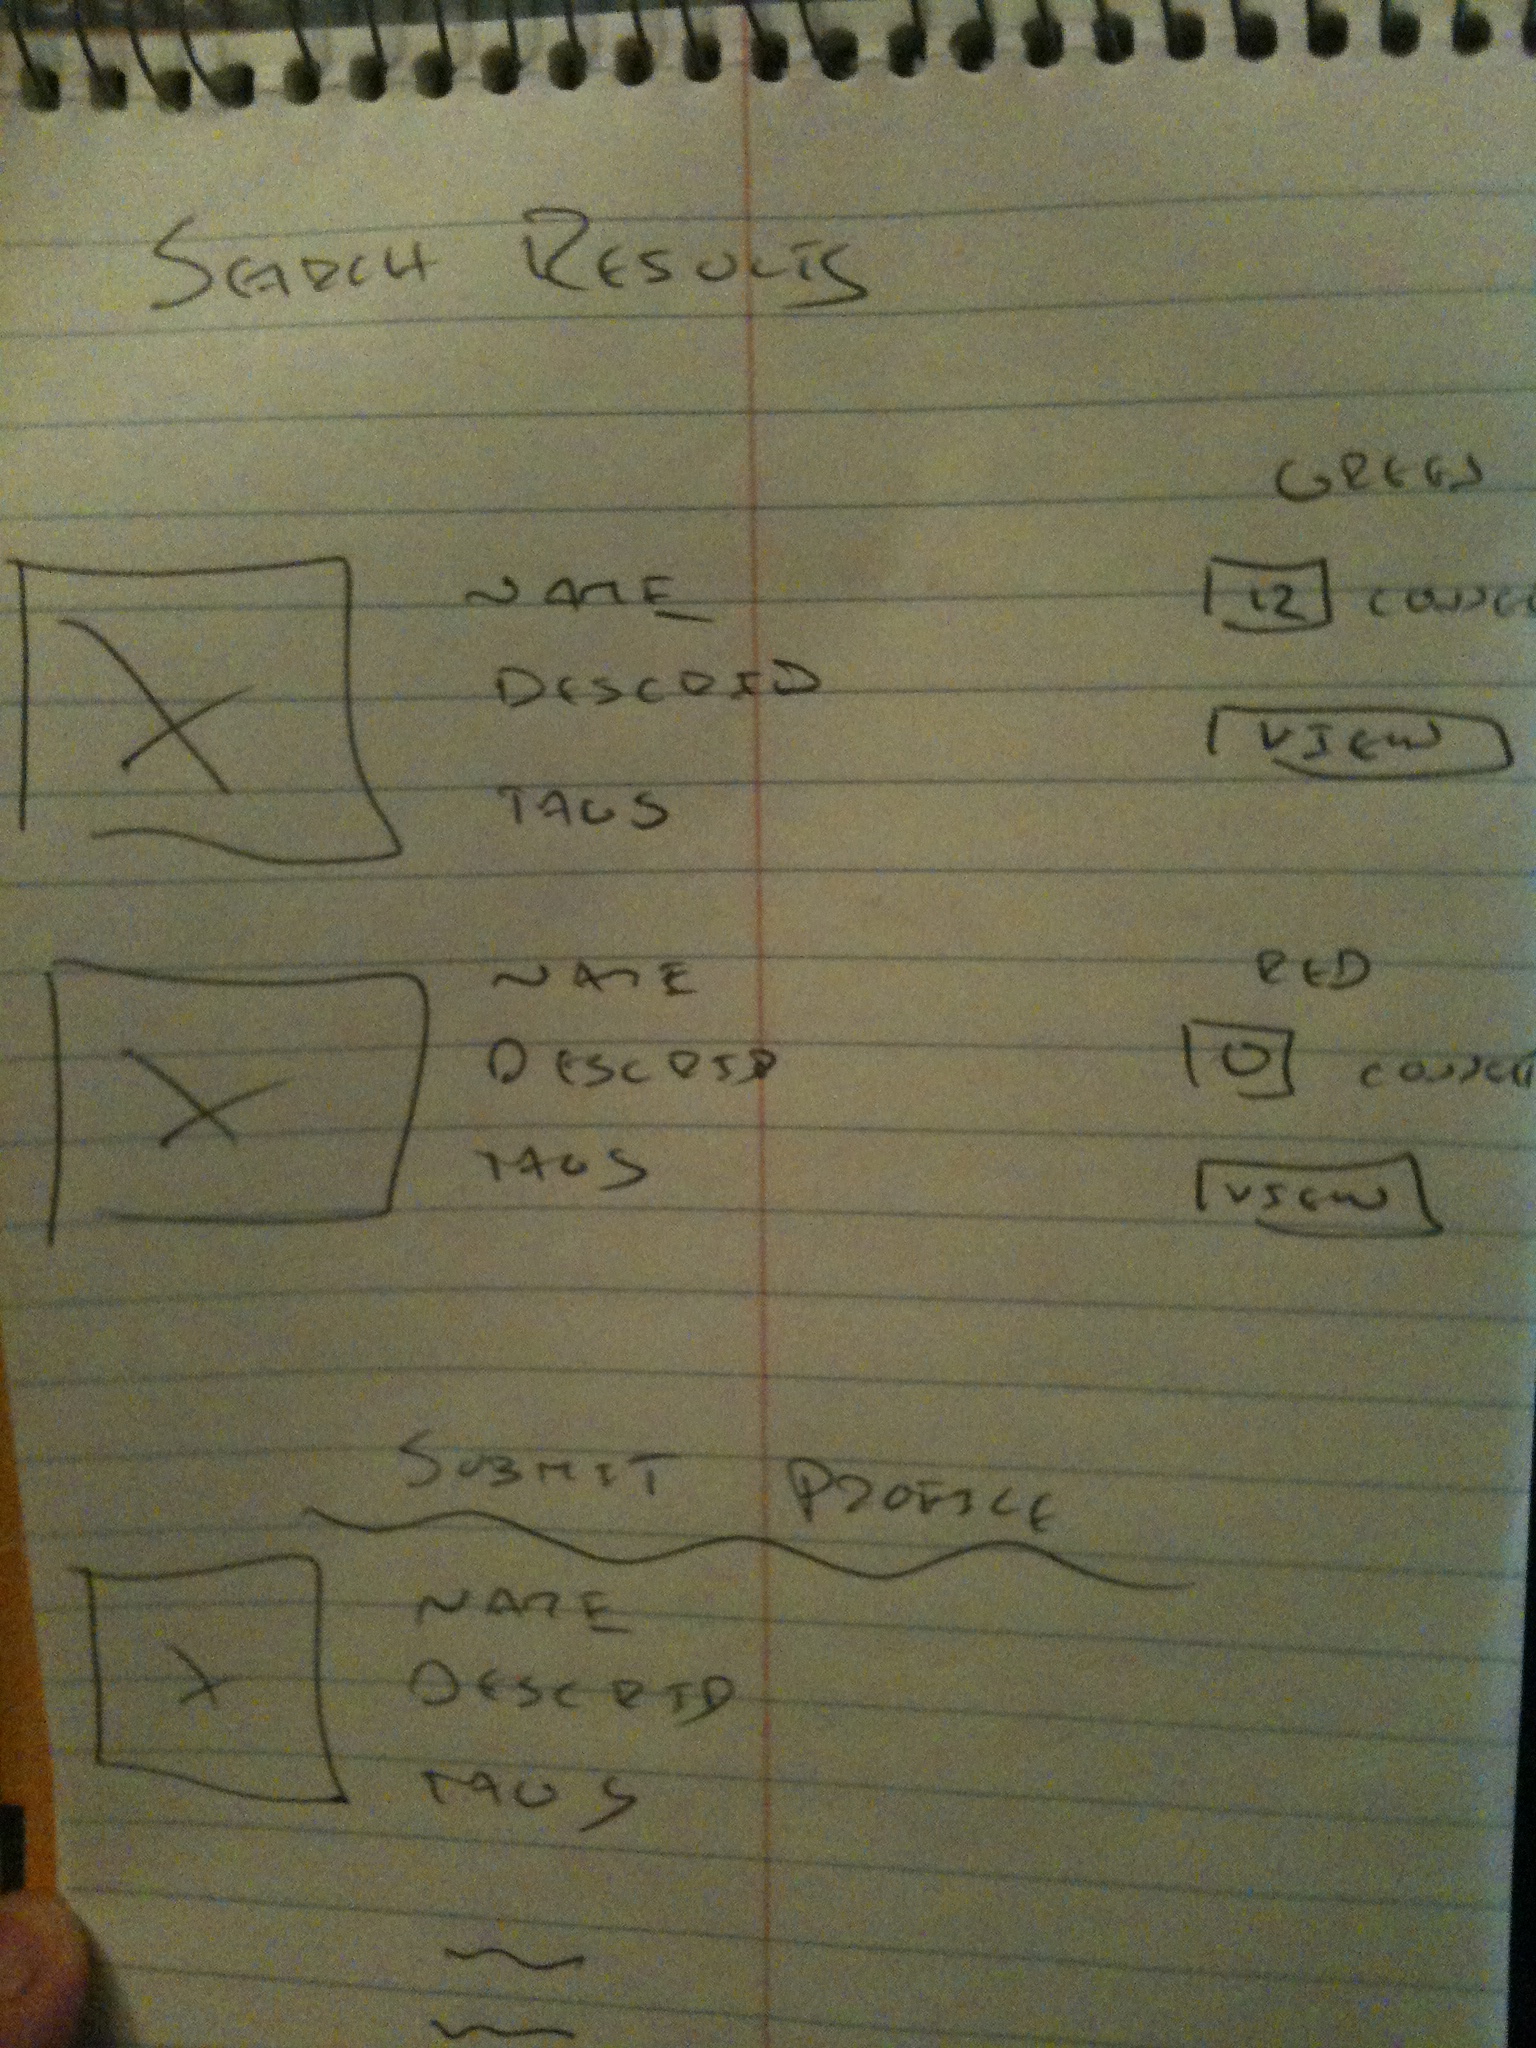
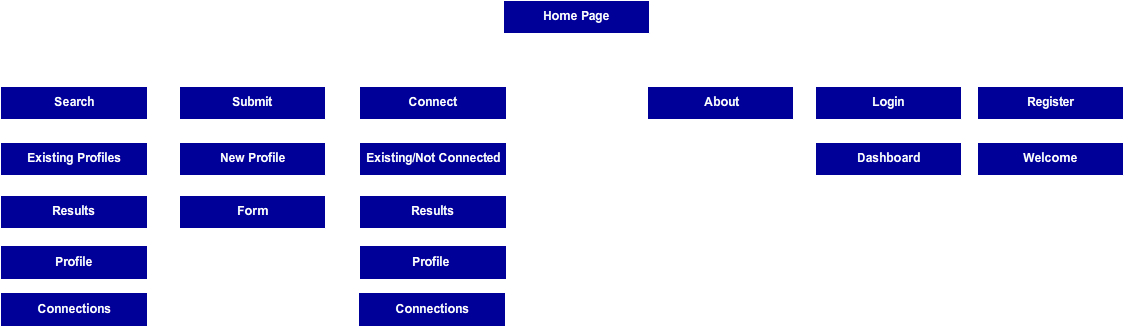
- Jotted down some simple sketches of a UI
- Applied the first chapter of jQuery: From Novice to Ninja to my idea for nwsmkr
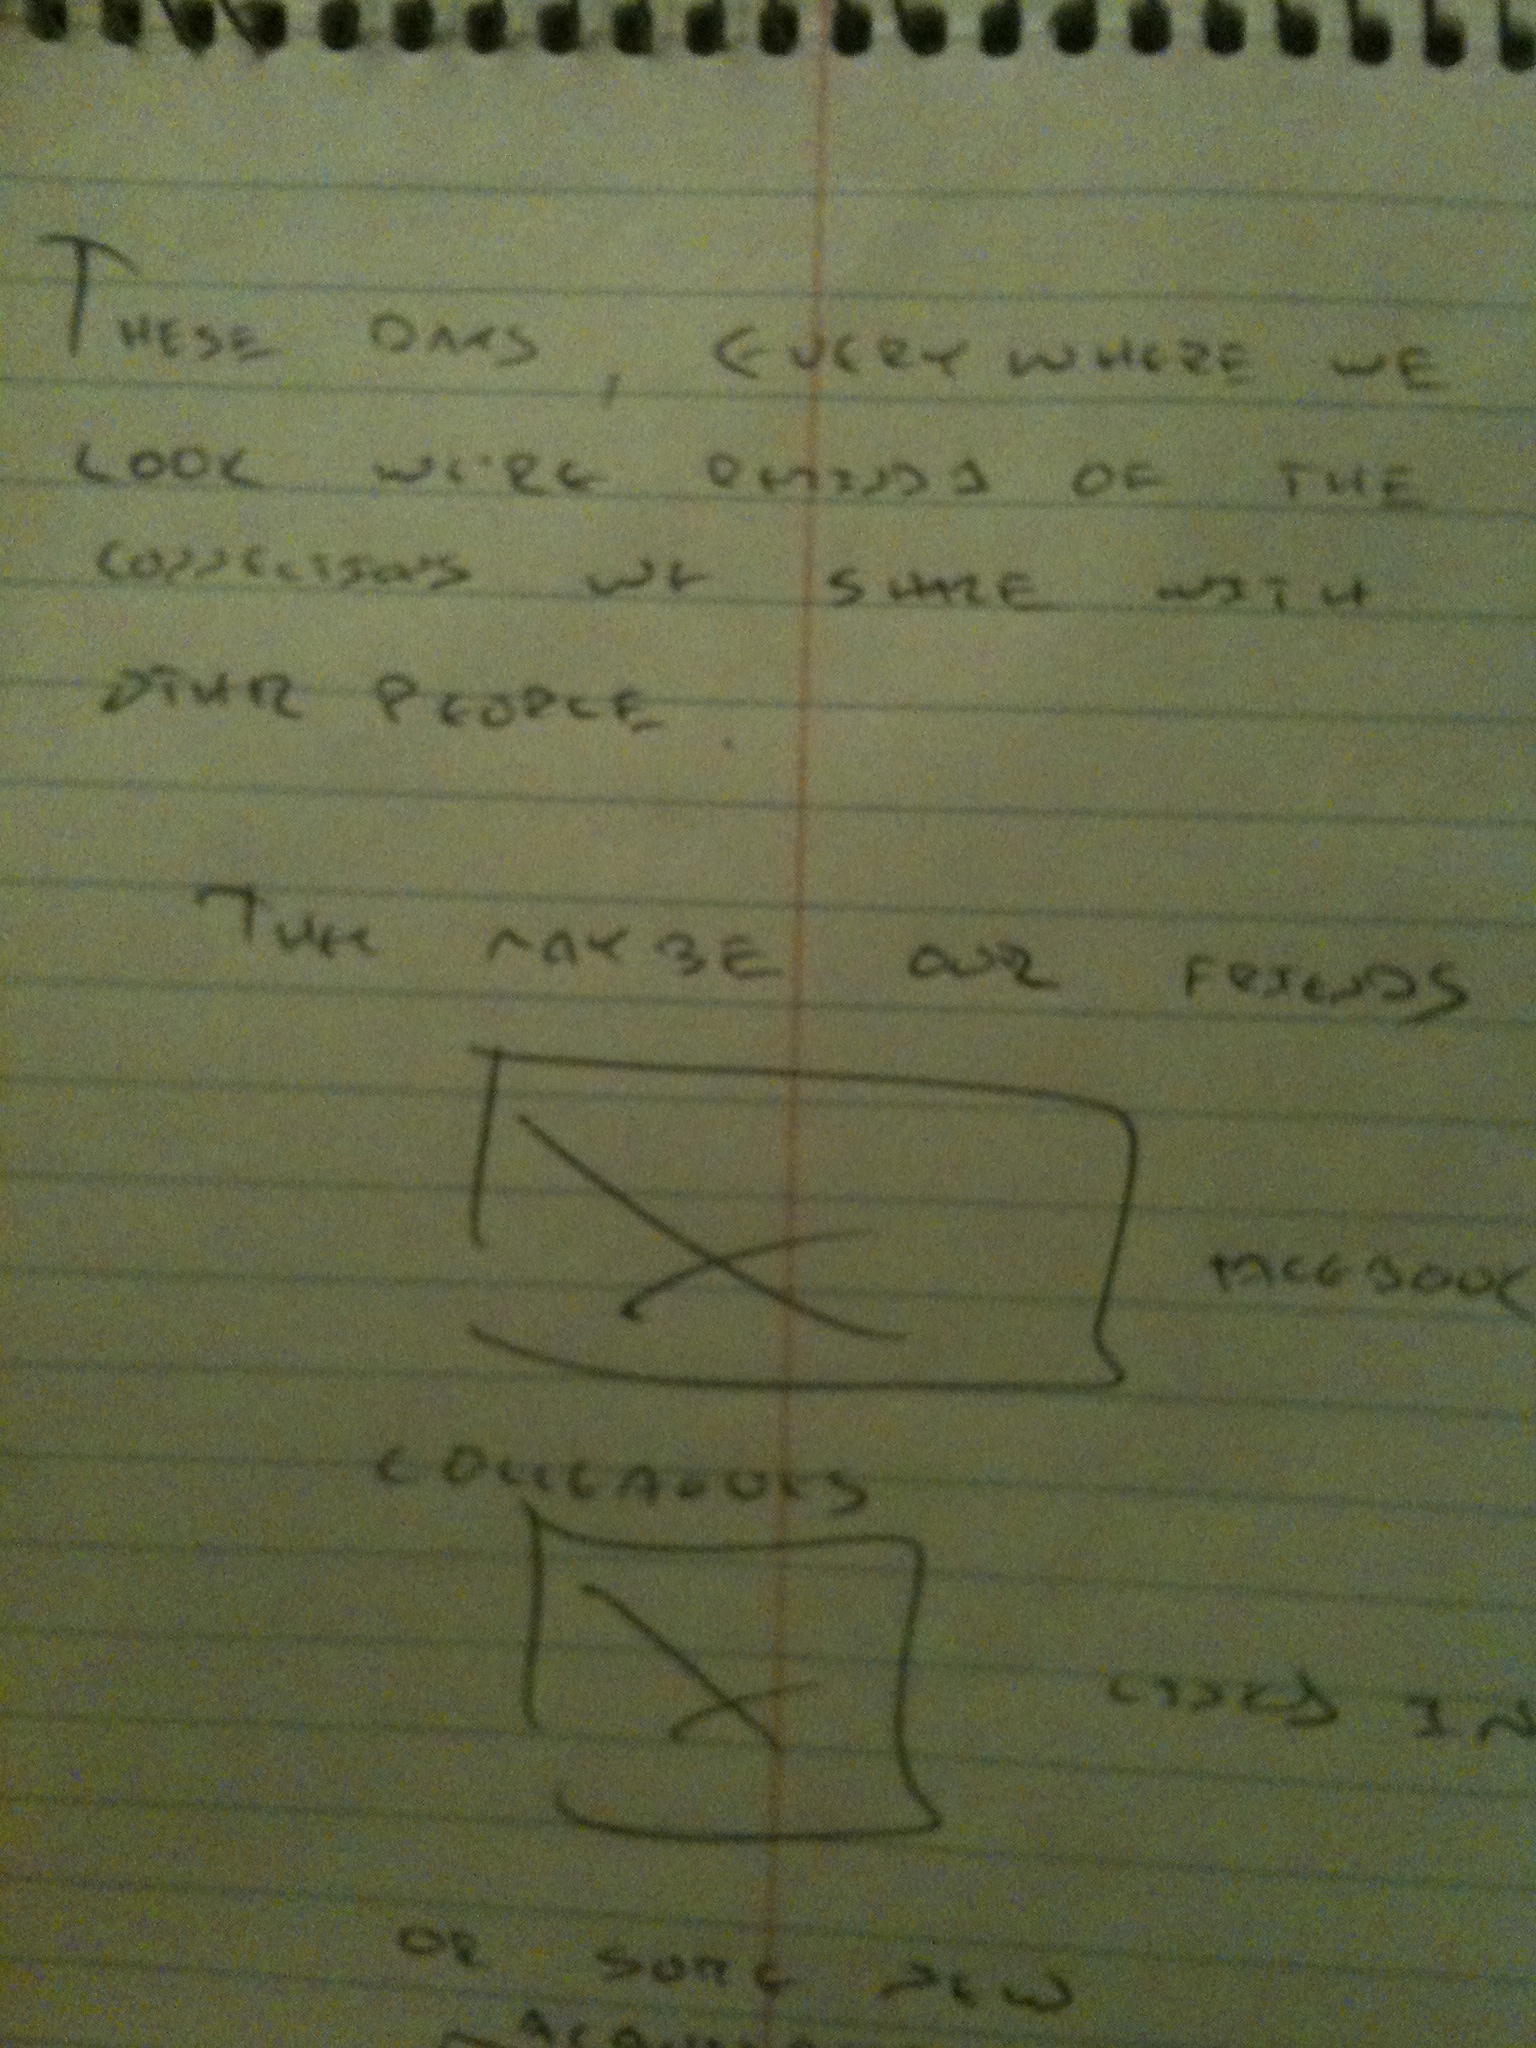
- Thought about how users might be exposed to the content
- Started a storyboard for the Show and Sell portion of the final project
- Spent time with Lil Brother
- And incorporated some great suggestions on how to improve on the idea from my former co-workers and colleagues
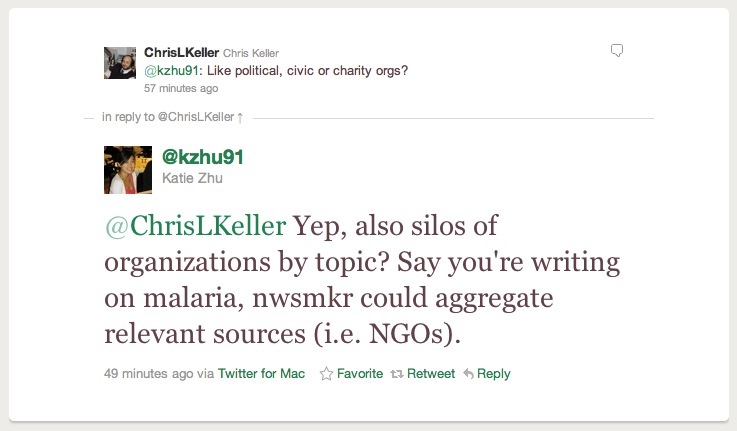
Fellow "Learning Labber" Katie Zhu suggested that nwsmkr could also visualize connections across organizations.
My confidence seems to waver on this project, and what seems great today can look ridden with peril the next, much like trying to return a ring to Mordor, so as far as I'm concerned, the more feedback the merrier at this point. You can leave any suggestions, criticisms, admonishments or cheering in in the comments below.
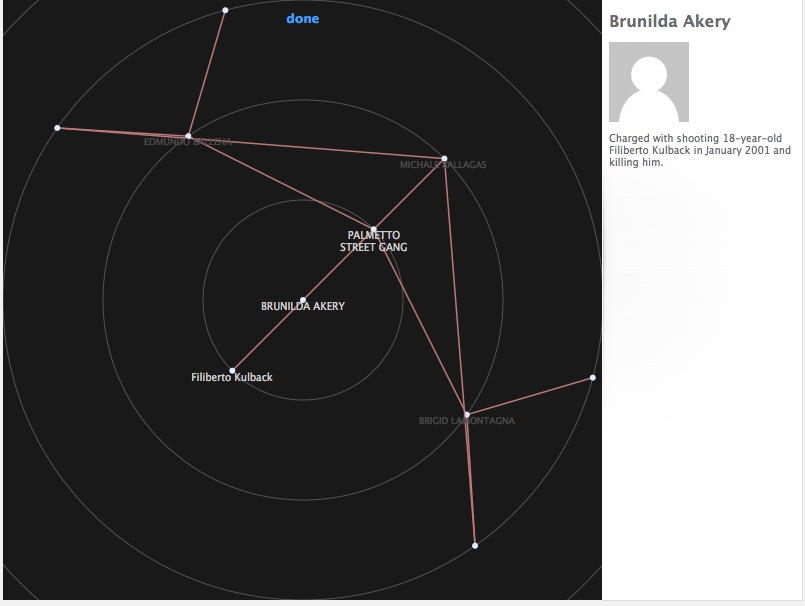
But to really see if this idea had legs, I dug out some old notes from a story I had worked on and tried to make sense of the connections between people using the online mockup tool Cacoo.
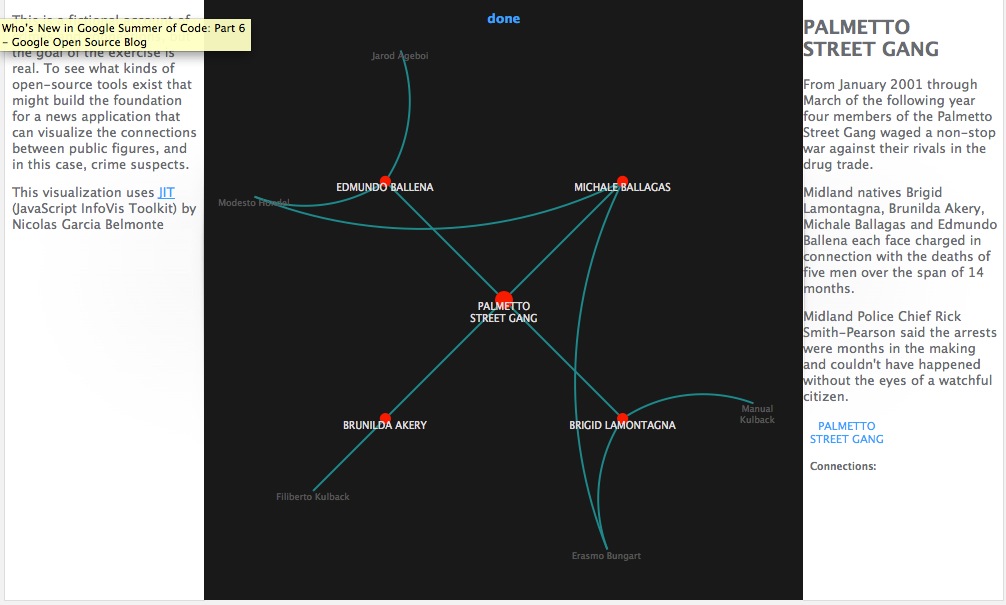
Tonight, I thought I'd try my hand at visualizing that Cacoo visual and jumped into JIT -- the JavaScript InfoVis Toolkit, an open-source library by Nicolas Garcia Belmonte.
I think the results -- based around the criminal exploits of the fictional Palmetto Street Gang from Midland USA -- are promising.
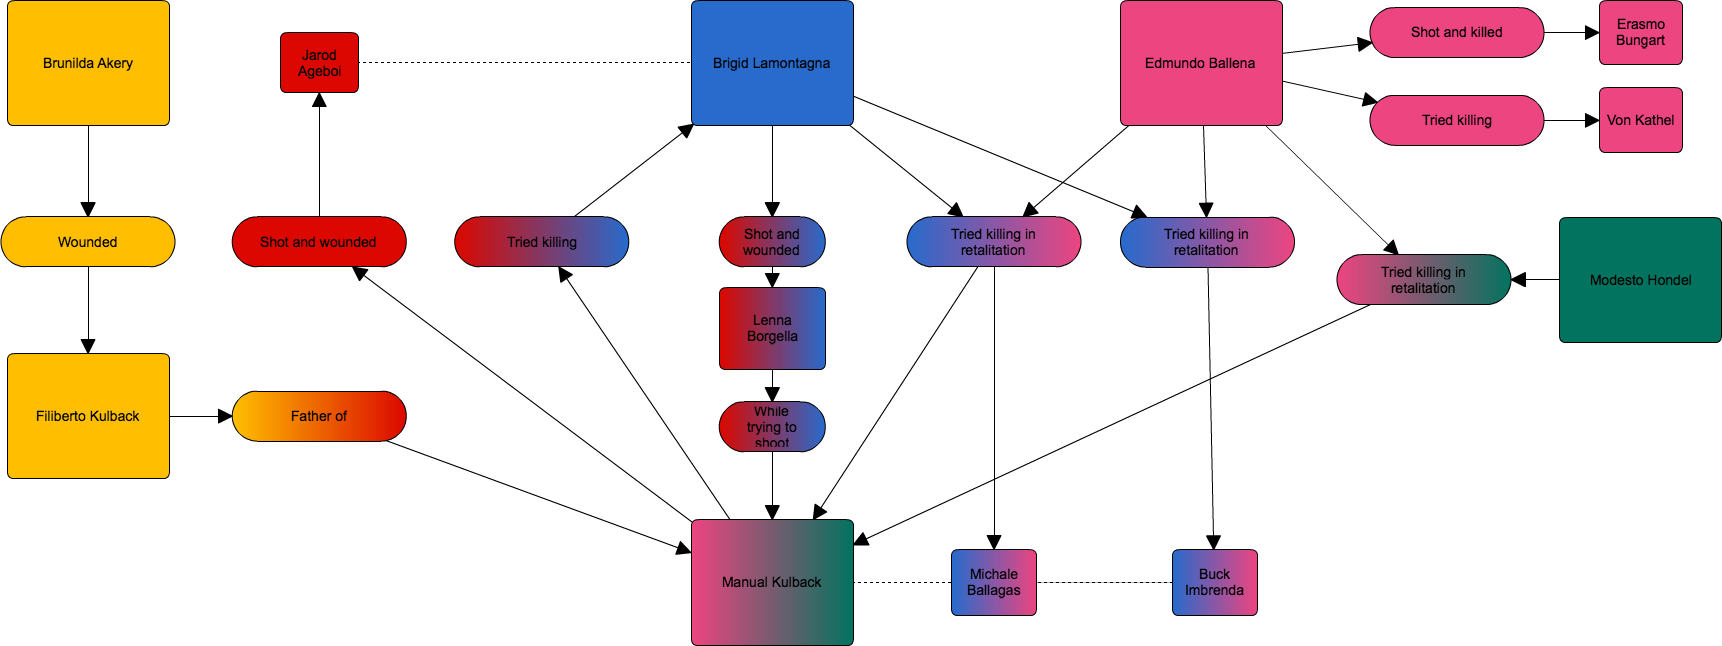
The bar to entry -- getting something off the ground -- seems fairly low, and like anything, the more you learn, the more you are able to do. I set out to not go deep in terms of styling or design. I simply wanted to plug in information, see what happened and be done with it so I could move on to other things.
The hardest aspect of getting either of these up and running was constructing the fictional narrative. That said, I only scratched the surface, which is short hand for found where the variables are and changed the information.
The visualizations are created from json, which I think I am closer than ever to understanding in that it's not only a way to store data, but is becoming a preferred way to store data because of how easily is can be parsed because it's already a javascript object... I think?
Anyway, I'm heading in to the final two weeks of this lab in good shape, but still undecided how I should demonstrate nwsmkr -- images only, a simple visualization like these or a touchy-feeling walkthrough.
Time is a ticking.