Mapping data: Wis. Supreme Court voting, Madison Mayoral Voting, State Life Expectancies & school funding
Published 2011-07-08
The last month has been one of enjoying some summer sun and some new found free time, but that doesn't mean there hasn't been learning going on. Thanks to guidance and suggestions from Jon Davenport, John Keefe, Christopher Groskopf, Brian Boyer and so many others, I've developed some skills at making data maps via Google's Fusion Tables and the Maps javascript API.
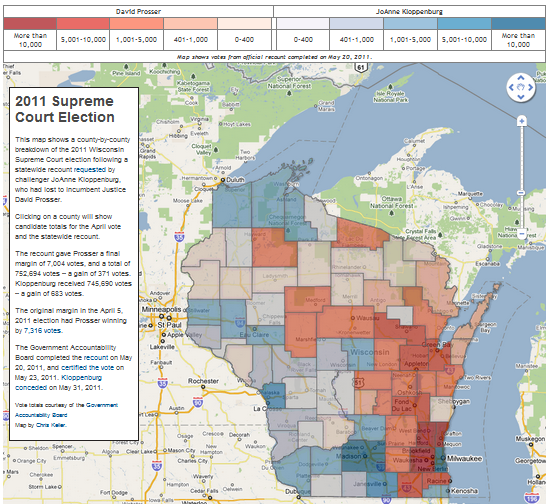
My first public attempt was a map of April's Supreme Court election in Wisconsin which was quickly outdated as other votes were discovered and a recount ordered.
That map provided a perfect opportunity to branch out and try some new things in terms of displaying the data, if only because there was so much of it that changed between the first vote and the certification of the recount. You can find the new version here on madison.com.
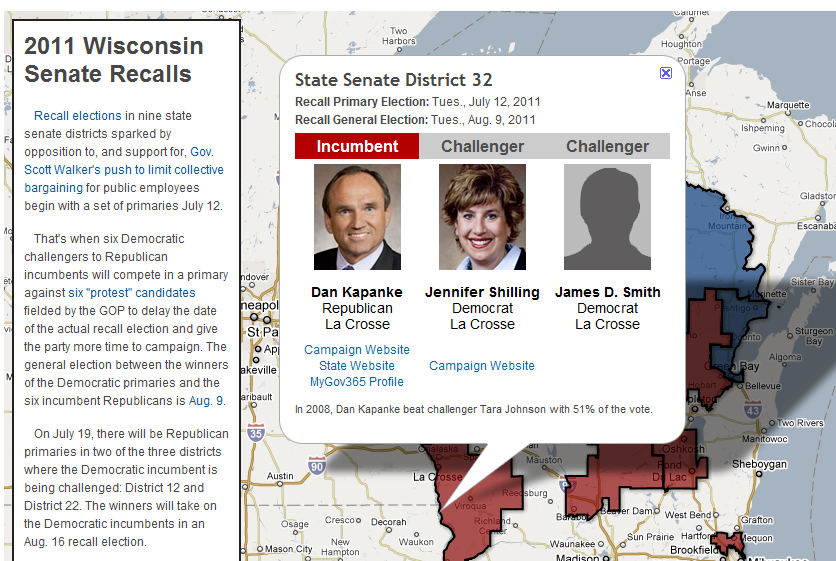
The tabbed info window may not be the most elegant, but it serves a purpose and I am able to learn from it, which counts for something.
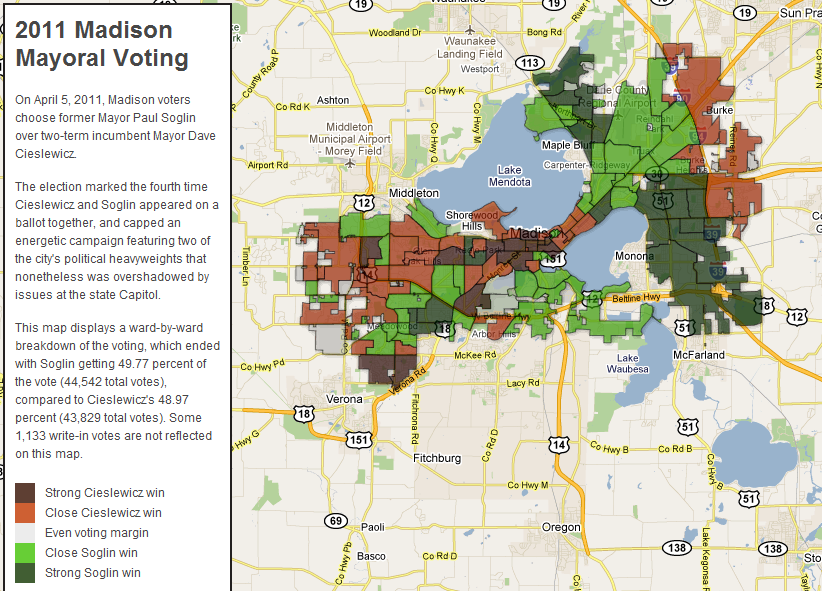
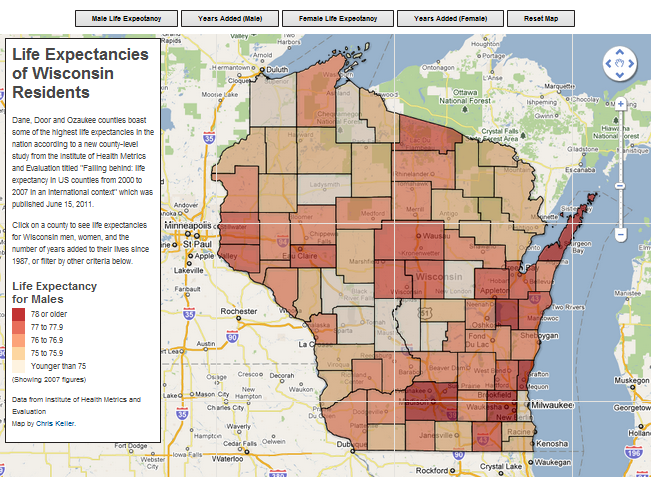
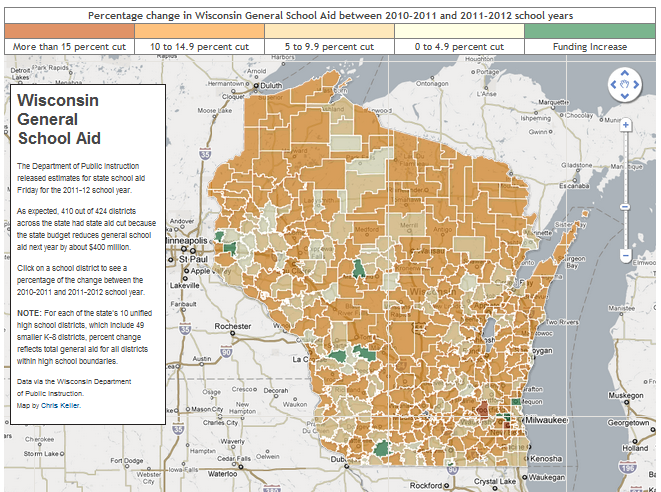
I also finished off a map of how Madison voted in April 2011 mayoral election, how life expectancies for Wisconsin men and women have changed since 1987, and Wisconsin Department of Public Instruction estimates for state school aid for the 2011-12 school year.
Learning how to use the Maps javascript API has also helped me make progress toward one of my goals for 2011, though these lean heavily -- OK downright mimic -- work by Jon, John, Chris and Brian.
Then again, there's something on the horizon that will help me put a checkmark next to many of those goals here in the coming months.