More fun with Highcharts and Fusion Tables
Published 2011-12-12
Further stripping down the Fusion-Tables-To-Highcharts project, this uses Google Fusion Tables as a data backend to draw a chart that uses the Highcharts.js library.
Unlike the previous project -- walkthrough is here -- this doesn't rely on a map click event to draw the chart, allowing this Fusion Table...
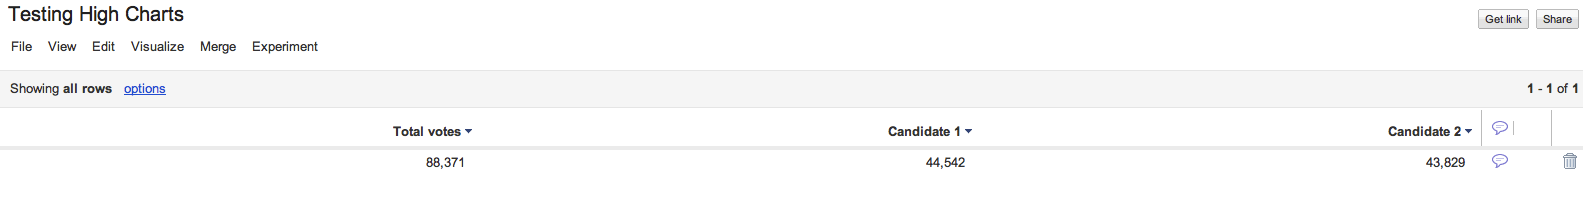
... to become this column chart ...
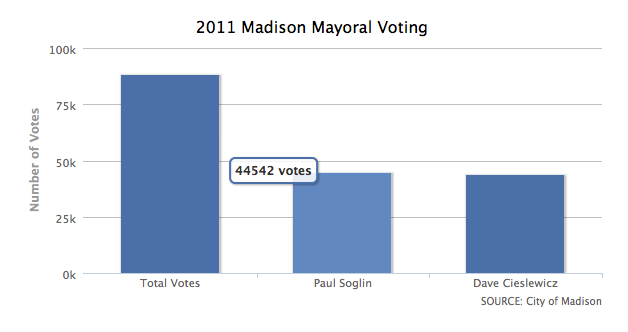
... or a bar chart ...
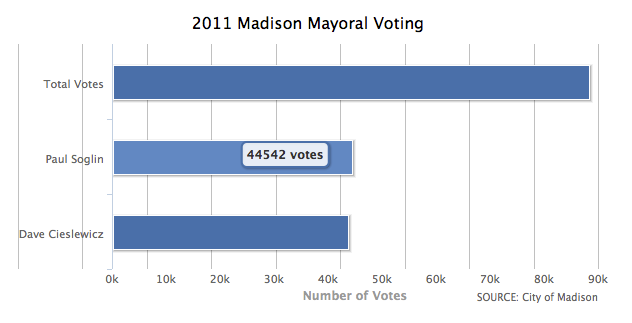
... or a line chart ...
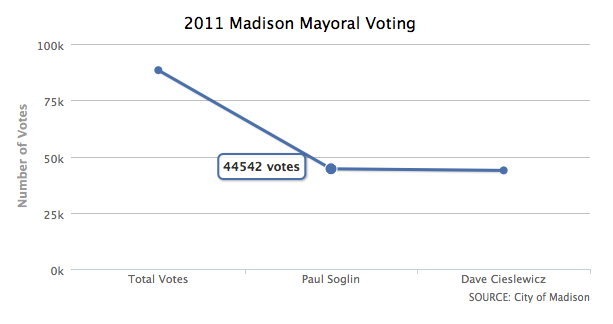
I've been interested in finding an easy to use datasource for these charts since Wisconsin State Journal multimedia and graphics gurus Jason Klein and Laura Sparks started to use the Highcharts javascript library to produce data visuals that could be used in print, on the web and on tablets.
The "problem" to solve is two-fold:
- It's nearly a must to be able to keep track of the historical business data that we're adding to highcharts visuals.
- Because this data is often in the hands of the reporter, the method for updating the charts needs to be ultra simple, and involve touching a little code as possible.
From here I'm thinking of learning from Kevin Schaul's recent project, the box-chart-maker, which has a great user-interface that will generate the code needed, and ideally figure out a way to write to and update data housed in a Fusion Table, at least by the time Wisconsin has what could be the first of six potential election nights in 2012.