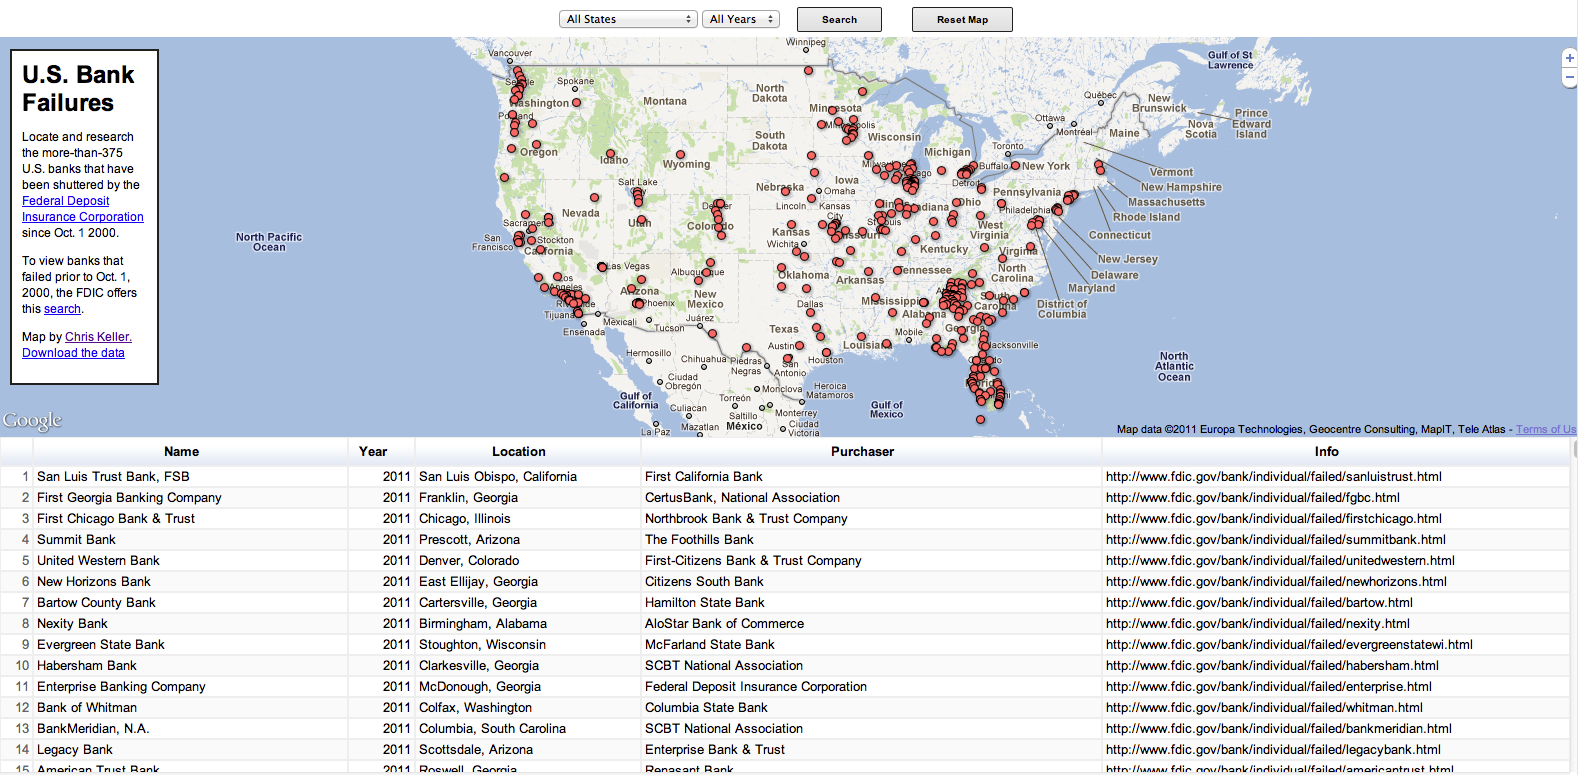
In the name of moving on to new things - per the Cult of Done - I bring you U.S. Bank Failures since 2000 - mapped and searchable (somewhat)
Published 2011-08-30
A key tenant of the Cult of Done Manifesto is "The point of being done is not to finish but to get other things done," and with that I consider myself done with this map of U.S. Bank Failures since 2000.
The code is up on GitHub if you want to grab it, make it better or see how a beginner unaware of shortcuts tackled this. You can also download the data. And if you have ideas on where this map can go from a journalistic standpoint, by all means, please leave them in the comments.
I owe the community a detailed walk-through on how these things -- FT & maps API -- come together so I'll get into how it came together tonight and link to it from this post. But here's some backstory on with an eye toward failing faster in the future, and really developing a process that lets the data dictate the form a project takes.
I started this project in May or June after reading this tutorial on scraping a HTML table into Google Docs. The example the used in the tutorial… Why the FDIC's List of Failed Banks of course.
Some facts gleaned from the failed banks data:
- Between 2009 and 2010, 297 banks were closed by federal regulators which came at a cost to the FDIC of $57 billion, according to The Associated Press
- Bank closings by the years (Through Aug. 30, 2011): 2010 - 154; 2009 - 140; 2011 - 68; 2008 - 25; 2002 - 11; 2001 - 4; 2004 - 4; 2003 - 3; 2007 - 3; 2000 - 2
- Bank closings by the months (Through Aug. 30, 2011): July - 63; April - 41; October - 38*; February - 35; January - 35; March - 32; May - 30; December - 29; August - 35; November - 26; September - 26; June - 24
- Zero bank closures since 2000: Alaska, Maine, Montana, North Dakota, Rhode Island, Vermont, District of Columbia
- Most bank closures since 2000 (Through Aug. 30, 2011): Georgia - 70; Florida - 58; Illinois - 48; California - 38; Washington - 17
And then the project stalled and stalled and stalled because I couldn't figure out why the table wouldn't appear in Internet Explorer 6, 7, 8, or 9… If there was an IE 10 out there it might have displayed the table, and seeing as I kept going with versions of this map I might have found out sooner or later.
But I left the project behind to focus on some other things for work: the Wisconsin Senate Recall Map, the 2011 Answer Book database and the All-Time Badger Football scores database.
But this week I got the gumption to see what lingering, half-completed data maps I had laying around -- which goes against Tenant 5 of the Cult of Done Manifesto: "Banish procrastination. If you wait more than a week to get an idea done, abandon it" -- and I started from scratch… scrapped all the code and started fresh.
Wouldn't you know, the map worked in IE… and kept working in IE.
And now, though there is much more that could be done with it, I call it done. Not finished, but done.
Looking at it now, this map seems to reside in no-man's-land. Too little information for it to become a really robust searchable map, but too much information to to be just a heatmap, though thinking about it now, a series of heatmaps for various years might tell the best story?
Any way, I plan to make it available to other papers with Lee Enterprises because it's content that touches all of our markets and is some kind of evergreen. And hopefully it will spark someone's imagination to see what they might be able to pull off.
So how did the map come together? Technically it's your basic Fusion Table map with a table built with FT data and written by Google Visualization API.
Specifically, it's a riff off of this map.
If you are ansty, go ahead and inspect that map with your favorite web dev browser tool, and once again the code for this Failed Banks map is on GitHub and hopefully you can follow along since I tend to use a lot of comments in my code.
I'm headed back to writing up a better walkthrough...
Some suggestions thus far: Via Ted Han: It'd be cool to see the spread/influence of each one. Are they a small indie bank, or one w/ branches across several states?